
Climate Crisis Through Data: a climate response bot
Compare Tuvalu's weather in February 1994 and 2024, then build a bot that sends pretend relief supplies when the data shows heavy rain or heat!
What you'll learn
- Explain the difference between weather and climate
- Collect open weather data and read temperature, rainfall and wind charts
- Build a model bot and program it with weather conditions
- Say what the data shows — and what it cannot prove
You need
- Curo AI Premium Kit: DC Motor, Master, LED and Sound blocks (see the parts list)
- PC or tablet with Chrome and Bluetooth
- Curo AI Weather Data Lab (weather.cubroid.com)
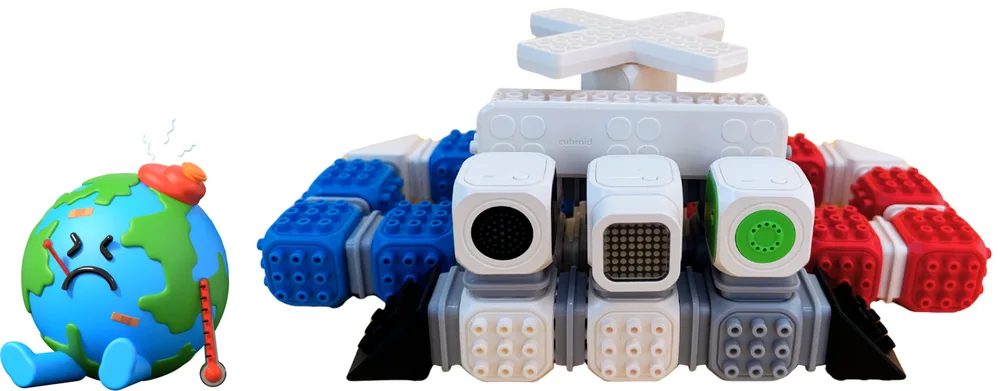
Explore Earth's signals
Notes for teachers
Grades 5–6, 2–3 lessons. You need the Curo AI Premium Kit (DC Motor, Master, LED and Sound blocks) and the Curo AI Weather Data Lab (weather.cubroid.com) in Chrome.
Curriculum links (Korea 2022): Science [6과06-01] weather factors and daily life · Math [6수04-03] collect data, choose a graph and interpret it · Practical arts [6실05-02] write a program that solves a problem.
Keep the claims careful: two February samples show differences, not a climate trend. 30 mm and 30 °C are classroom examples, not official alerts. The bot is a classroom role play.
What does rising sea level mean for a low-lying island country such as Tuvalu?
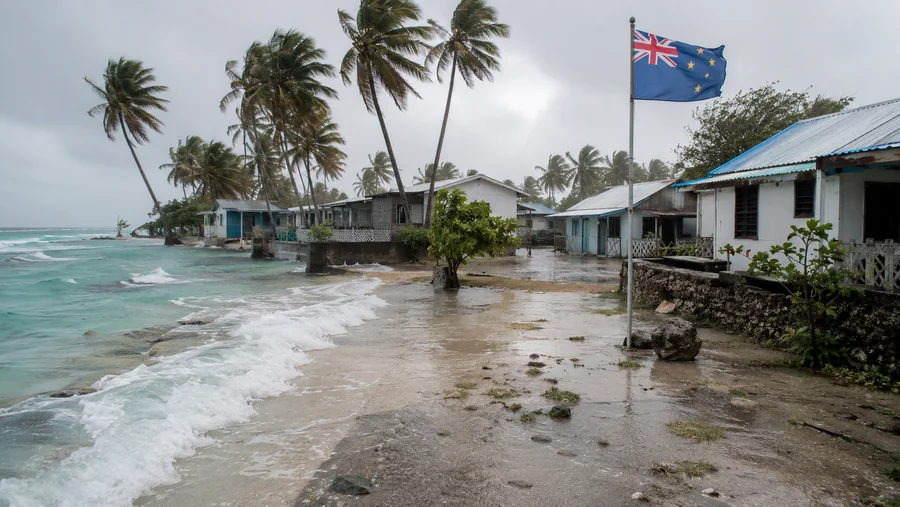
What is happening in Tuvalu?

Tuvalu's low coast is exposed to sea-level rise and flooding. Rising seas can threaten homes, land and everyday life. Talk about what the news shows — and what it does not show.
What is the climate crisis?
 Weather
- Short-term conditions: today's temperature, rain and wind.
- It can change from day to day.
 Climate
- Patterns over many years.
- Changes can increase risks from heat, heavy rain and other extreme weather.
💡 Two February months are only samples. They cannot prove a long-term climate trend or its cause: climate needs records over many years.
Compare Tuvalu's weather data
What is open public data?
 Public agencies collect dataGovernments and public agencies collect and organize information.
 Data is shared openlyIt is made available so everyone can use it.
 People use the dataWe can ask questions and think about solutions.


Collect the data in the Weather Data Lab
Open the Curo AI Weather Data Lab
Go to hub.cubroid.com and choose “Weather Data”, or open weather.cubroid.com directly.
Choose Tuvalu, February, 1994 and 2024
Choose “Year compare” and search “Tuvalu”. Set the month to February and the range to “Full month”. Select only 1994 and 2024, then press “Get Weather Data!”.
Check the data
Check the dates and the units. Use the series buttons to see each year.
💡 February 1994 has 28 days and February 2024 has 29 days. Compare with care.
Predict first
Before you look at the charts, predict how the two Februaries might differ. Write your prediction.
Read the temperature chart
x: day of February
QWhat does the vertical axis show?
Show answer
Temperature (°C) — Each point is the highest temperature of one day.
QOn which days in February 2024 was the maximum at least 30 °C?
Show answer
February 2, 18, 19, 25 and 27 — These points are on or above the red dashed line.
QWhich February has higher daily maximum temperatures?
Show answer
February 2024 — The 2024 line is above the 1994 line on most days.
QWhat can this comparison not tell us?
Show answer
A long-term trend or its cause — Two February months are only samples. They cannot prove a long-term climate trend or its cause: climate needs records over many years.
Read the rainfall chart
x: day of February
QWhat does the vertical axis show?
Show answer
Daily rainfall (mm) — Each bar is the rain of one day.
QWhich day had the most rain?
Show answer
February 6, 2024 · 66.3 mm — It is the tallest bar.
QWhich February has more days with at least 30 mm of rain?
Show answer
February 2024 (9 days; 1994: 0 days) — Count the bars above the red dashed line. Remember: 28 days and 29 days.
Read the wind chart
x: day of February
QWhich metric and unit are shown?
Show answer
Daily maximum wind speed, km/h — Compare the same metric and the same unit for both years.
QIn February 2024, which day had the strongest wind?
Show answer
February 6 · 53.0 km/h — That was also the day with the most rain.
What do the samples show?
Describe the differences between the two Februaries in your own words.
💡 Two February months are only samples. They cannot prove a long-term climate trend or its cause: climate needs records over many years.
Build a climate response bot
Let's build a model bot that sends pretend relief supplies to a blue rain zone or a red heat zone. This is a classroom role play.
Why might people need relief supplies?



Meet the Curo AI blocks
 DC Motor BlockMoves the supplies toward the rain zone or the heat zone.
 Master BlockShows the kind of danger with the color of its light.
 LED BlockShows the weather state with a face.
 Sound BlockPlays a warning sound.
Parts we need
- × 1

- × 1

- × 1

- × 1

- × 22

- × 4

- × 1

- × 1

- × 2

- × 1

- × 1

- × 19

The 19 cubes include the blue cubes for the rain zone and the red cubes for the heat zone.
Build the bot
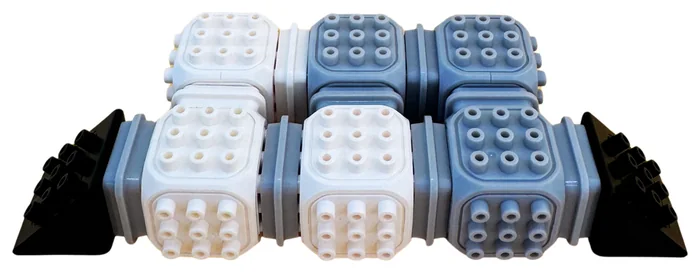
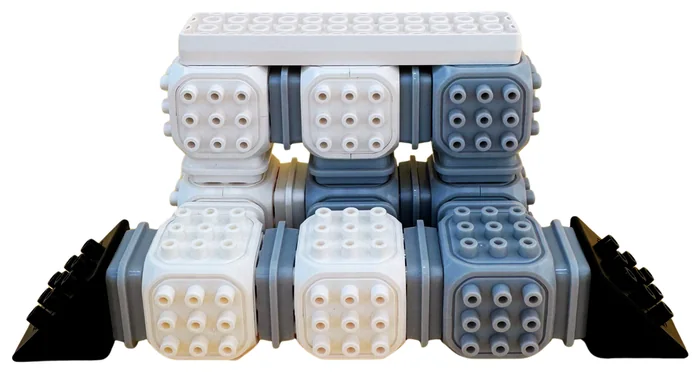
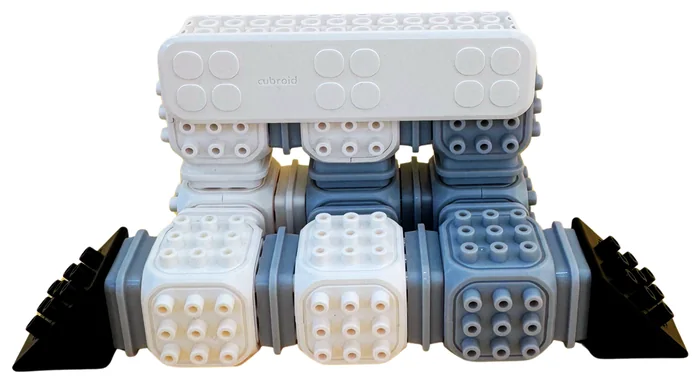

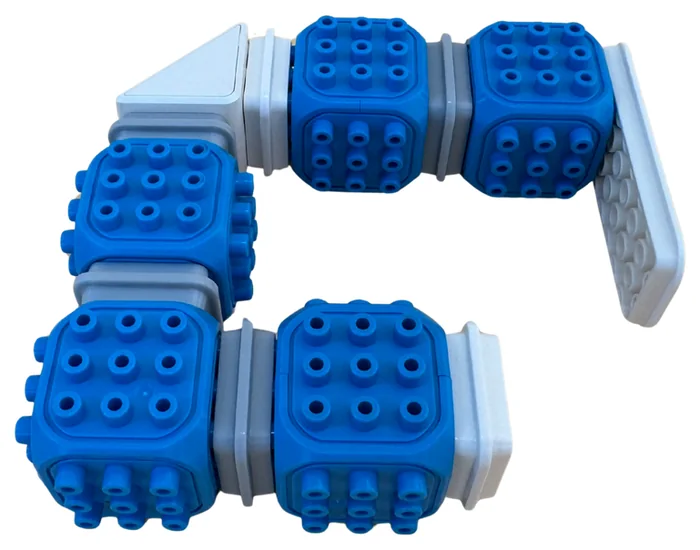

 Finished!The climate response bot
 Pretend suppliesUse connector blocks as the relief supplies.
Program the bot
Connect the Curo AI blocks
In the Weather Data Lab, choose “Connect Blocks”. Set the group number, press “Connect”, switch on the blocks and finish pairing.
Program with weather data
The lab replays the recorded daily data, one day per second (Normal speed). It is not a live sensor.
Meet the coding blocks
when new day data arrives :: hat #FFBF00
<(today's precipitation :: #5CB1D6) ≥ (30) :: #59C059>

<(today's max temperature :: #5CB1D6) ≥ (30) :: #59C059>
if <(today's precipitation :: #5CB1D6) ≥ (30) :: #59C059> do {
LED [Sad v] show :: #9966FF
} :: #FFAB19
Design weather → robot rules
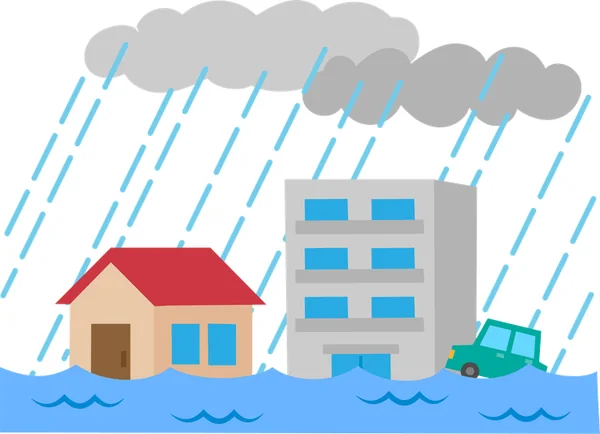 Rain rule (blue zone)
- Today's rainfall ≥ 30 mm
- Motor turns right for 1 second
- LED: sad face · Master: blue
- Sound: warning
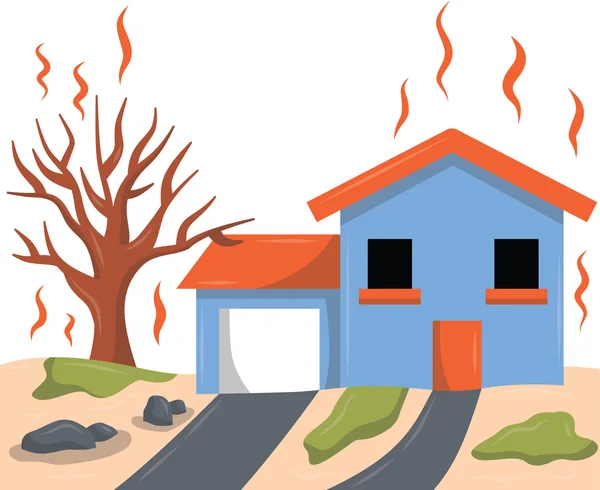 Heat rule (red zone)
- Today's maximum temperature ≥ 30 °C
- Motor turns left for 1 second
- LED: angry face · Master: red
- Sound: your choice
Program the rain rule
If today's rainfall is at least 30 mm, the bot sends supplies to the blue rain zone.
💡 This is a classroom rule, not a flood alert.
when new day data arrives :: hat #FFBF00
if <(today's precipitation :: #5CB1D6) ≥ (30) :: #59C059> do {
DC Motor 1 (1) seconds [rotate right v] :: #4C97FF
LED [Sad v] show :: #9966FF
Set master to [#1f8bf0] color :: #8E9199
sound [Warn v] play :: #0FBD8C
} :: #FFAB19Add the heat rule
Add a second rule: if today's maximum temperature is at least 30 °C, send supplies to the red heat zone.
💡 Both rules can run on the same day. Test both, and check which way the motor turns on your model.
when new day data arrives :: hat #FFBF00
if <(today's precipitation :: #5CB1D6) ≥ (30) :: #59C059> do {
DC Motor 1 (1) seconds [rotate right v] :: #4C97FF
LED [Sad v] show :: #9966FF
Set master to [#1f8bf0] color :: #8E9199
sound [Warn v] play :: #0FBD8C
} :: #FFAB19
if <(today's max temperature :: #5CB1D6) ≥ (30) :: #59C059> do {
DC Motor 1 (1) seconds [rotate left v] :: #4C97FF
LED [Angry v] show :: #9966FF
Set master to [#e8453c] color :: #8E9199
sound [Big effect v] play :: #0FBD8C
} :: #FFAB19Run the replay
Press “Start”. Watch the bot on the days that match a rule. “Example” loads the example program again.
Write a learning report
Open the “Learning Report” tab. Write what you investigated and what you think, then press “Generate Report”.
Improve and reflect

How could we use weather data more carefully?
Try a mission

Mission 1Add a wind condition.
Mission 2Act only when rainfall AND wind are both high.
Mission 3Make your own rule with the LED, Sound and Master blocks.
💡 Choose your own thresholds, test your rules, record what happens and explain your choices.
What did we learn?
QWhich weather data and period did you use?
Show answer
Example — Tuvalu, February 1994 and February 2024: daily maximum temperature, rainfall and wind.
QWhen a condition was true, what did the bot do?
Show answer
Example — On rainy days it turned right, showed a sad face, lit blue and played a warning.
QWhat did this role play model — and what did it not prove?
Show answer
Example — It showed how data can trigger actions. It did not prove a climate trend.
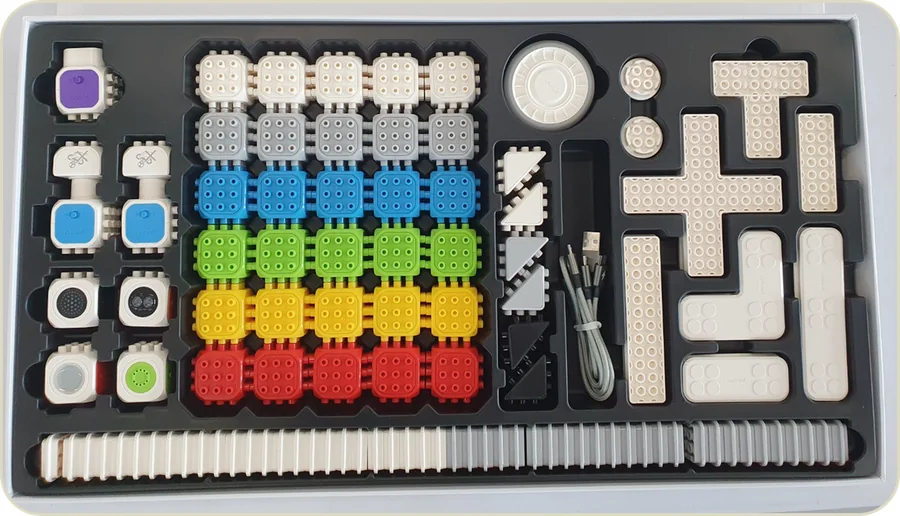
Put the parts back in place
Lesson complete!
Built it, coded it and tested it? Tap to save your progress.